Understanding the Silent Majority in Our Online Communities

Kelly McNamara
Sr. Director, Community Development
By Kelly McNamara
Sr. Director, Community Development – Health Union
November 9th, 2015
“Why do lurkers lurk and what do they do?”1 The 90–9–1 rule of thumb has been applied to many digital and online communities. 90% tend to be less vocal but still engaged, 9% tend to be more vocal by commenting and/or sharing, and the remaining 1% tend to be the most vocal by creating new content2. The lurkers are the 90%. While the exact ratio is highly debated and perhaps outdated, the idea that lurkers or what we refer to as the “silent majority” make up a large portion of online communities still holds true.
Katz calls the silent majority “one of the Net’s biggest disenfranchised groups, unseen or heard.” He believes by ignoring the silent majority our perceptions of them are skewed and it allows our agendas to be determined by a community’s smallest group3. The silent majority are not necessarily less engaged, their engagement habits in online communities are just are different. Given the nature of the health communities we develop, comfort levels over sharing personal health experiences may differ, so it comes as no surprise the majority of our members tend to publicly comment less often.
It’s easy for us to see and analyze vocal members. But, just as Katz proposes, we maintain that it’s our responsibility to reach and engage as many segments of our community as we can. For us to see the entire picture, it’s just as important to see, analyze, and understand the silent majority.
The silent majority feels a sense of belonging to our communities, but their level of happiness or unhappiness isn’t as easily observed as it is with more visible community members. So, how do we know we’re keeping the lurkers happy and satisfying their wants and needs? Nonnecke and Preece apply the uses and gratification theory to help explore the silent majority’s behaviors. Why are the silent majority putting “considerable time and effort” into a community? What sense of gratification are they getting? Is it information, conversation, connections and sense of community, or access to expertise?1 We also have to understand there’s niche segments within the silent majority. We can’t lump them all into one group and make generalizations. This is where we rely heavily on data and analytics.
The Tools We Use to Measure Community Engagement:
Facebook Metrics
On Facebook, it’s easy to see the engagement of a mature community whether through comments, likes, or shares. Even in a mature community, though, the silent majority still is a large segment. Monthly, we pull data on both the page and post levels for evaluation. This gives us a glimpse into habits of all community members. For a post, we may analyze who’s clicking through versus who’s commenting. We may see a post that has a staggering amount of comments but looking closer, the number of people clicking through to the site is low and vice versa. Both data points are different ways to measure success. And, depending on the type of content, different data points are more relevant than others.

For example, we held our first Ask Me Anything session on Facebook, where community members asked our experts questions in real time and our experts answered. This was a one-and-done event much different from our normal type of content, which usually has a longer lifespan. The points of measurement which we regularly measure success were not applicable here. We viewed the AMA as a success not because it was a driver back to our site, but for the engaging conversation that occurred within our community during such a short period of time.
We’re checking comments multiple times a day. So, it’s easy to only hear the opinions of vocal members. Jumping into the data provides us with insights into our members regardless of their engagement habits in communities.
Google Analytics
Similar to Facebook metrics, identifying the right measures of success is vital in evaluating our communities and habits of our members. Optimal times to publish content are often dictated by when members are more likely to visit our sites. Recently, we evaluated our content schedule, to determine if it’s good practice to continue posting content on Sundays. Our assumption always was that weekends were our highest days of traffic and community engagement. We found the traffic metrics provided by the silent majority showed otherwise. Facebook reach might be higher on Sundays, but the actual click through rate back to the site was no different than any other day of the week. This data point couldn’t be measured through comments from vocal community members. This is just one example of what the data Google Analytics provides us and where understanding the silent majority plays a pivotal role.
Google AdWords
Some members are pretty vocal in letting us know the content they’re looking for and the reason they’re a part of our community. For the majority of members, whose objectives of gratification are less clear, Google AdWords is one tool we use to help us define the silent majority’s wants and needs. AdWords allows us to see what people are searching for. For example, recently one of our contributors reached out asking for tips for searching on a certain topic. By seeing the volume of various keywords and search terms, Google AdWords allowed us to give her alternative search terms.
Internally, we use AdWords to find missing topic areas in our available content. We use the keyword planner to search for certain keywords. This query will provide a list of what’s searched and the search volume. Most of the high volume searches we already have content on. As Katz states, in many online communities much of the silent majority is often overlooked or generalized3. So, it’s the smaller volume searches that give us a view into content we might be missing for niche segments.

For example, migraine and headache are high volume search terms but scalp pain, while still an important topic to niche segments, isn’t as popular of a search term. Conversely, high volume searches affirm we’re on the right track with our core content.
Surveys/Polls
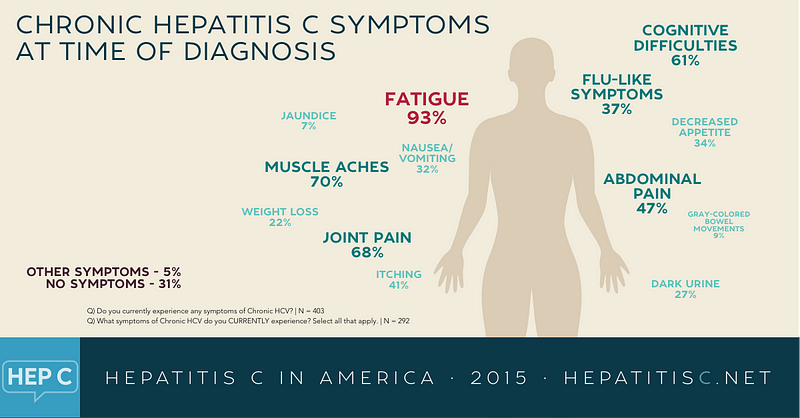
We regularly offer surveys and polls to our members. These play a key role in helping us observe our members, and provide us insight on what members are experiencing, what they’re doing and what they want. Many of our members want to share their feedback and opinions but feel too shy to do so in public spaces such as Facebook or our sites. Our surveys and polls are anonymous, so allow all members to share their experiences at their own comfort level. The results from these help us provide more content in areas we believe our members are interested in. For example, our Hepatitis C survey showed us fatigue and maintaining quality of life were to important issues for the community. For a community, that often feels stigmatized, we used the survey data to guide us in creating content that members might not be comfortable asking for through public comments.
What’s Next? — Content Analysis
Much of the data we’ve been gathering is quantitative. There are areas we want to further explore, especially taking a look at qualitative data. For some of our communities, it’s easy to see what content resonates and what doesn’t. For other communities, active engagement isn’t necessarily our goal. The community is less interested in commenting or sharing but they’re still engaged. For these communities, we need to better understand and define what success means to us. What we use as a measurement of success in one community isn’t necessarily what we would use to measure success in another community. Our next step for one particular community is to do a deep dive into analysis of our content. We want to establish categories and sub-categories to which we can code each of our articles. Hopefully, this will give us a better idea of the relationships between our content and relationships between our content and community members.
In understanding our communities, we realize the ‘silent majority’ makes up a big portion. The community engagement habits of the silent majority may differ and not be as obvious as the 1% or 9%. To be successful it’s critical we’re reaching all segments within our community. Understanding the behaviors and seeking to satisfy the specific wants and needs of the silent majority is as much as our responsibility as it is for community members who are more comfortable commenting. Katz asked a group of less vocal members what makes them feel more comfortable in online communities and members responded “no anonymous postings, moderated discussions, a ban on personal insults.”3 These are just some of the methods we employ to make sure all our members feel comfortable.
Is silent majority a large segment of your community? What tools do you use to explore what brings them gratification? Let us know!
- Nonnecke B & Preece J. Why Lurkers Lurk. Association for Information Systems AIS Electronic Library (AISeL). 2001 Dec. Accessed October 23, 2015.
- Van Mierlo T. The 1% Rule in Four Health Social Networks: An Observational Study. J Med Internet Res. 2014 Feb; 16(2): e33. Accessed October 29, 2015.
- Katz J. Luring the Lurkers. Available at http://slashdot.org/features/98/12/28/1745252.shtml. Published on December 29,1998. Accessed on November 2, 2015.
